Date: June 2023
CONFERENCE/VALUE IN HEALTH INFO:
N°P147, 2023-06, European Hematology Association (EHA) Congress 2023, Frankfurt, Germany
Abstract
Background
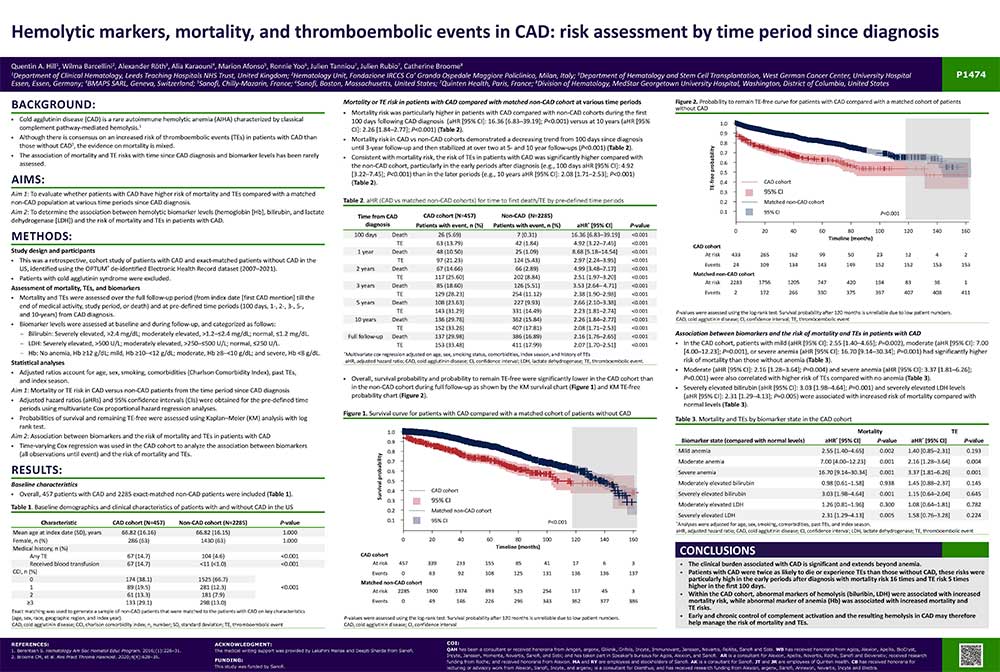
Cold agglutinin disease (CAD) is a rare autoimmune hemolytic anemia (AIHA) characterized by classical complement pathway-mediated hemolysis.
- Although there is consensus on an increased risk of thromboembolic events (TEs) in patients with CAD than those without CAD2, the evidence on mortality is mixed.
- The association of mortality and TE risks with time since CAD diagnosis and biomarker levels has been rarely
assessed.
Methods
Study design and participants
- This was a retrospective, cohort study of patients with CAD and exact-matched patients without CAD in the US, identified using the OPTUM® de-identified Electronic Health Record dataset (2007–2021).
- Patients with cold agglutinin syndrome were excluded.
Assessment of mortality, TEs, and biomarkers
- Mortality and TEs were assessed over the full follow-up period (from index date [first CAD mention] till the end of medical activity, study period, or death) and at pre-defined time periods (100 days, 1-, 2-, 3-, 5-, and 10-years) from CAD diagnosis.
- Biomarker levels were assessed at baseline and during follow-up, and categorized as follows:
-
- Bilirubin: Severely elevated, >2.4 mg/dL; moderately elevated, >1.2─≤2.4 mg/dL; normal, ≤1.2 mg/dL.
- LDH: Severely elevated, >500 U/L; moderately elevated, >250─≤500 U/L; normal, ≤250 U/L.
- Hb: No anemia, Hb ≥12 g/dL; mild, Hb ≥10─<12 g/dL; moderate, Hb ≥8─<10 g/dL; and severe, Hb <8 g/dL.
Statistical analyses
- Adjusted ratios account for age, sex, smoking, comorbidities (Charlson Comorbidity Index), past TEs, and index season.
- Aim 1: Mortality or TE risk in CAD versus non-CAD patients from the time period since CAD diagnosis
- Adjusted hazard ratios (aHRs) and 95% confidence intervals (CIs) were obtained for the pre-defined time periods using multivariate Cox proportional hazard regression analyses.
- Probabilities of survival and remaining TE-free were assessed using Kaplan–Meier (KM) analysis with log rank test.
- Aim 2: Association between biomarkers and the risk of mortality and TEs in patients with CAD
- Time-varying Cox regression was used in the CAD cohort to analyze the association between biomarkers (all observations until event) and the risk of mortality and TEs.
Results
Baseline characteristics
- Overall, 457 patients with CAD and 2285 exact-matched non-CAD patients were included.
Mortality or TE risk in patients with CAD compared with matched non-CAD cohort at various time periods
- Mortality risk was particularly higher in patients with CAD compared with non-CAD cohorts during the first 100 days following CAD diagnosis (aHR [95% CI]: 16.36 [6.83─39.19]; P<0.001) versus at 10 years (aHR [95% CI]: 2.26 [1.84─2.77]; P<0.001) (Table 2).
- Mortality risk in CAD vs non-CAD cohorts demonstrated a decreasing trend from 100 days since diagnosis until 3-year follow-up and then stabilized at over two at 5- and 10 year follow-ups (P<0.001) (Table 2).
- Consistent with mortality risk, the risk of TEs in patients with CAD was significantly higher compared with the non-CAD cohort, particularly in the early periods after diagnosis (e.g., 100 days aHR [95% CI]: 4.92 [3.22─7.45]; P<0.001) than in the later periods (e.g., 10 years aHR [95% CI]: 2.08 [1.71─2.53]; P<0.001) (Table 2).
Association between biomarkers and the risk of mortality and TEs in patients with CAD
- In the CAD cohort, patients with mild (aHR [95% CI]: 2.55 [1.40─4.65]; P=0.002), moderate (aHR [95% CI]: 7.00 [4.00─12.23]; P=0.001), or severe anemia (aHR [95% CI]: 16.70 [9.14─30.34]; P=0.001) had significantly higher risk of mortality than those without anemia (Table 3).
- Moderate (aHR [95% CI]: 2.16 [1.28─3.64]; P=0.004) and severe anemia (aHR [95% CI]: 3.37 [1.81─6.26]; P=0.001) were also correlated with higher risk of TEs compared with no anemia (Table 3).
- Severely elevated bilirubin (aHR [95% CI]: 3.03 [1.98─4.64]; P=0.001) and severely elevated LDH levels (aHR [95% CI]: 2.31 [1.29─4.13]; P=0.005) were associated with increased risk of mortality compared with normal levels (Table 3)
Conclusion
The clinical burden associated with CAD is significant and extends beyond anemia.
- Patients with CAD were twice as likely to die or experience TEs than those without CAD, these risks were particularly high in the early periods after diagnosis with mortality risk 16 times and TE risk 5 times higher in the first 100 days.
- Within the CAD cohort, abnormal markers of hemolysis (biluribin, LDH) were associated with increased mortality risk, while abnormal marker of anemia (Hb) was associated with increased mortality and TE risks.
- Early and chronic control of complement activation and the resulting hemolysis in CAD may therefore help manage the risk of mortality and TEs


